Report for Logistic Regression Model Logistic_Regression
Basic Summary
Call: glm(formula = pres.abs ~ northing + easting + altitude + distance + NoOfPools + NoOfSites + avrain + meanmin + meanmax, family = binomial("logit"), data = the.data)
Deviance Residuals:
| Min |
1Q |
Median |
3Q |
Max |
| -1.899 |
-0.799 |
-0.274 |
0.803 |
2.699 |
Coefficients:
|
|
Estimate |
Std. Error |
z value |
Pr(>|z|) |
|
| (Intercept) |
-1.635e+02 |
2.153e+02 |
-0.7593665 |
0.44763 |
|
| northing |
1.041e-02 |
1.654e-02 |
0.6295167 |
0.52901 |
|
| easting |
-2.158e-02 |
1.268e-02 |
-1.7021689 |
0.08872 |
. |
| altitude |
7.091e-02 |
7.705e-02 |
0.9202495 |
0.35744 |
|
| distance |
-4.835e-04 |
2.060e-04 |
-2.3468672 |
0.01893 |
* |
| NoOfPools |
2.968e-02 |
9.444e-03 |
3.1429110 |
0.00167 |
** |
| NoOfSites |
4.294e-02 |
1.095e-01 |
0.3923186 |
0.69482 |
|
| avrain |
-4.033e-05 |
1.300e-01 |
-0.0003102 |
0.99975 |
|
| meanmin |
1.564e+01 |
6.479e+00 |
2.4148495 |
0.01574 |
* |
| meanmax |
1.708e+00 |
6.809e+00 |
0.2507938 |
0.80197 |
|
|
|
Significance codes: 0 '***' 0.001 '**' 0.01 '*' 0.05 '.' 0.1 ' ' 1
|
(Dispersion parameter for binomial taken to be 1 )
|
Null deviance: 279.99 on 211 degrees of freedom Residual deviance: 195.66 on 202 degrees of freedom
McFadden R-Squared: 0.3012, Akaike Information Criterion 215.7
Number of Fisher Scoring iterations: 6
Type II Analysis of Deviance Tests
|
Response: pres.abs
|
|
|
LR Chi-Sq |
DF |
Pr(>Chi-Sq) |
|
| northing |
0.397 |
1 |
0.52872 |
|
| easting |
2.933 |
1 |
0.08678 |
. |
| altitude |
0.854 |
1 |
0.35529 |
|
| distance |
7.441 |
1 |
0.00638 |
** |
| NoOfPools |
11.299 |
1 |
0.00078 |
*** |
| NoOfSites |
0.153 |
1 |
0.69534 |
|
| avrain |
0 |
1 |
0.99975 |
|
| meanmin |
6.091 |
1 |
0.01358 |
* |
| meanmax |
0.063 |
1 |
0.80171 |
|
|
|
Significance codes: 0 '***' 0.001 '**' 0.01 '*' 0.05 '.' 0.1 ' ' 1
|
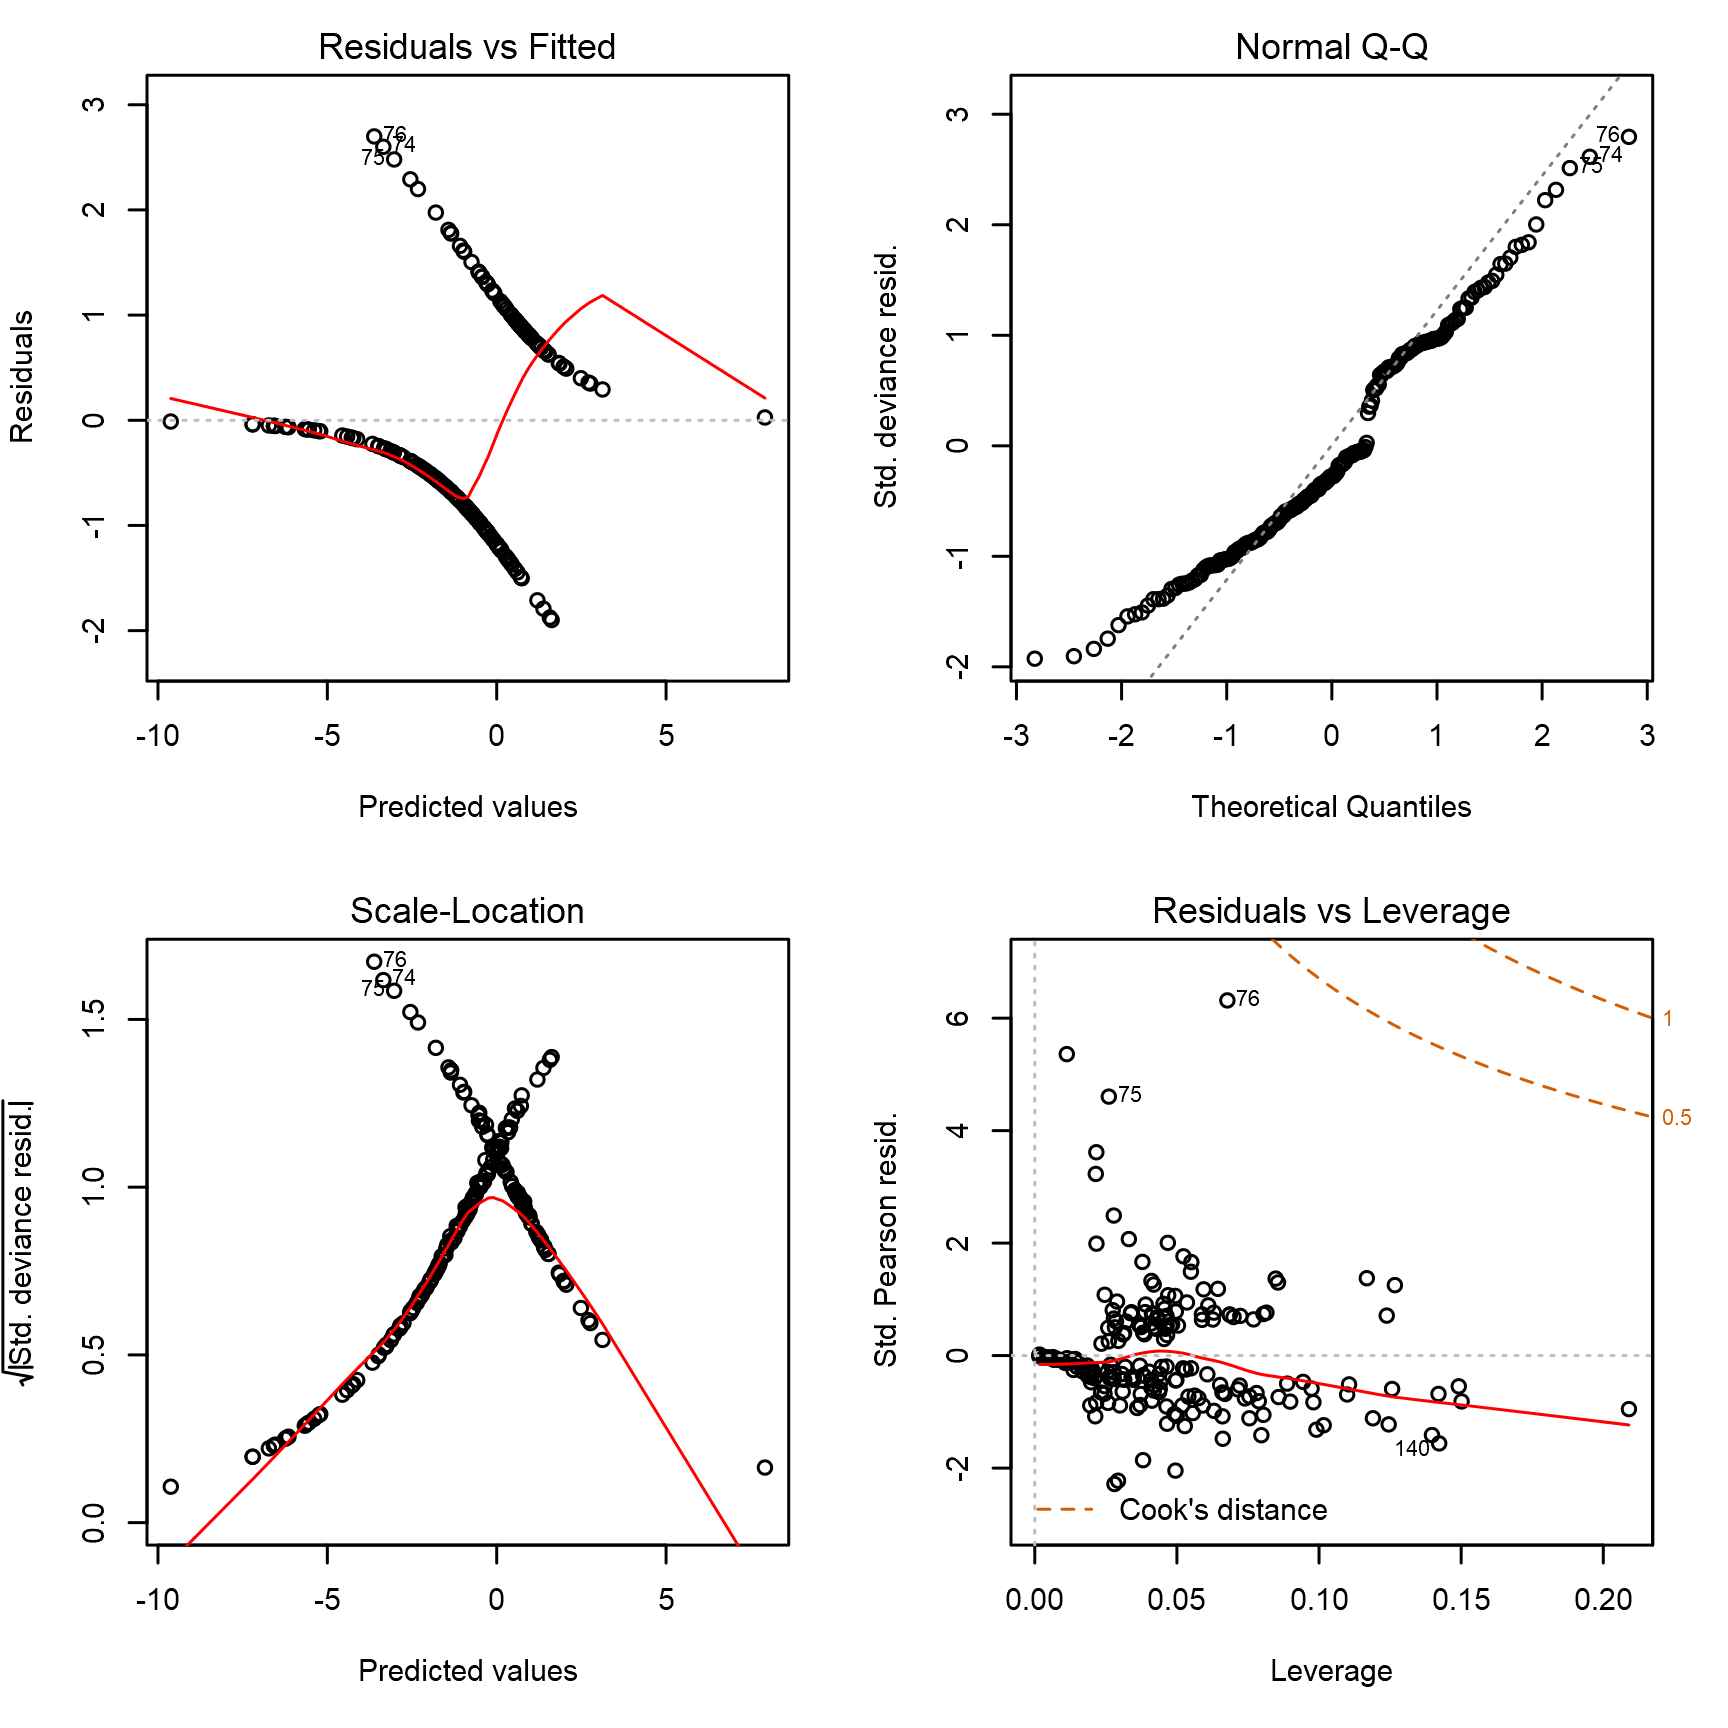
Basic Diagnostic Plots
Performance Diagnostic Plots with 95% Confidence Interval
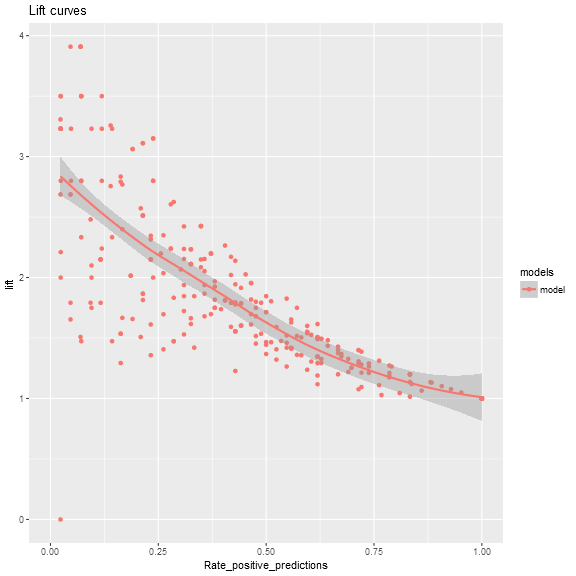
Performance Diagnostic Plots with 95% Confidence Interval
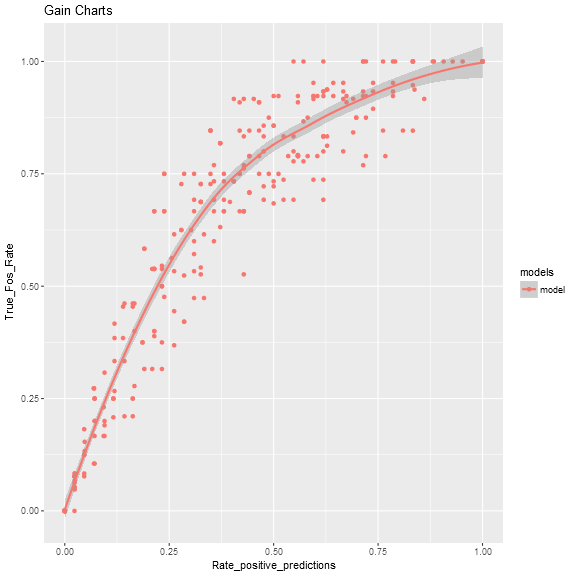
Performance Diagnostic Plots with 95% Confidence Interval
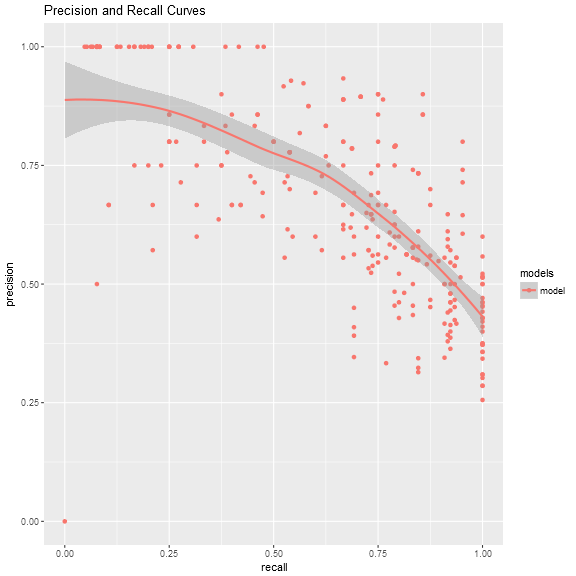
Performance Diagnostic Plots with 95% Confidence Interval
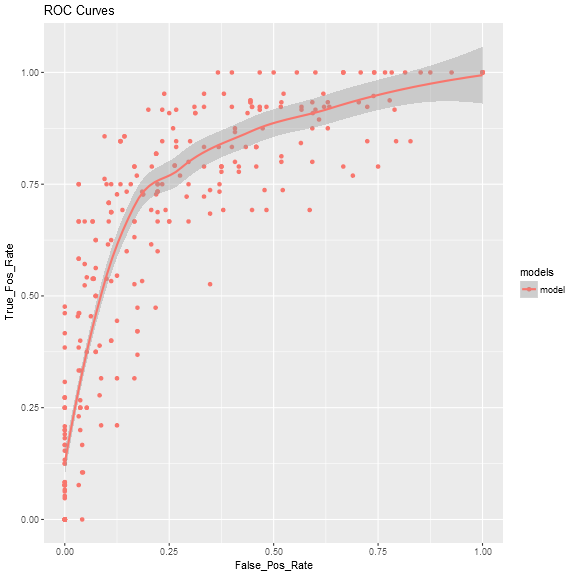
Model fit metrics (average per model)
| Avg_Accuracy_Class_1 |
Avg_Accuracy_Class_2 |
Avg_Accuracy_Overall |
Avg_AUC |
Avg_F1 |
| 0.838160 |
0.697895 |
0.782761 |
0.824039 |
0.700602 |