Report for Logistic Regression Model Logistic_Regression
Basic Summary
Call: glm(formula = pres.abs ~ northing + easting + altitude + distance + NoOfPools + NoOfSites + avrain + meanmin + meanmax + northing.easting + meanmin.meanmax, family = binomial("logit"), data = the.data)
Deviance Residuals:
| Min |
1Q |
Median |
3Q |
Max |
| -2.023 |
-0.745 |
-0.308 |
0.778 |
2.590 |
Coefficients:
|
|
Estimate |
Std. Error |
z value |
Pr(>|z|) |
|
| (Intercept) |
-3.059e+02 |
2.453e+02 |
-1.2467 |
0.21249 |
|
| northing |
1.774e-01 |
1.360e-01 |
1.3049 |
0.19192 |
|
| easting |
2.512e-02 |
3.545e-02 |
0.7087 |
0.47849 |
|
| altitude |
5.924e-02 |
7.842e-02 |
0.7554 |
0.45001 |
|
| distance |
-4.171e-04 |
2.098e-04 |
-1.9885 |
0.04675 |
* |
| NoOfPools |
3.071e-02 |
9.992e-03 |
3.0738 |
0.00211 |
** |
| NoOfSites |
7.316e-02 |
1.141e-01 |
0.6410 |
0.5215 |
|
| avrain |
2.638e-01 |
2.410e-01 |
1.0946 |
0.27371 |
|
| meanmin |
1.909e+01 |
6.912e+00 |
2.7624 |
0.00574 |
** |
| meanmax |
8.204e+00 |
8.090e+00 |
1.0142 |
0.31048 |
|
| northing.easting |
-1.477e-04 |
1.163e-04 |
-1.2696 |
0.20422 |
|
| meanmin.meanmax |
-6.919e-01 |
4.816e-01 |
-1.4368 |
0.15078 |
|
|
|
Significance codes: 0 '***' 0.001 '**' 0.01 '*' 0.05 '.' 0.1 ' ' 1
|
(Dispersion parameter for binomial taken to be 1 )
|
Null deviance: 279.99 on 211 degrees of freedom Residual deviance: 193.3 on 200 degrees of freedom
McFadden R-Squared: 0.3096, Akaike Information Criterion 217.3
Number of Fisher Scoring iterations: 6
Type II Analysis of Deviance Tests
|
Response: pres.abs
|
|
|
LR Chi-Sq |
DF |
Pr(>Chi-Sq) |
|
| northing |
1.745 |
1 |
0.18651 |
|
| easting |
0.509 |
1 |
0.47575 |
|
| altitude |
0.573 |
1 |
0.4491 |
|
| distance |
5.086 |
1 |
0.02412 |
* |
| NoOfPools |
11.091 |
1 |
0.00087 |
*** |
| NoOfSites |
0.409 |
1 |
0.5227 |
|
| avrain |
1.2 |
1 |
0.2733 |
|
| meanmin |
8.005 |
1 |
0.00467 |
** |
| meanmax |
1.04 |
1 |
0.30775 |
|
| northing.easting |
1.66 |
1 |
0.19767 |
|
| meanmin.meanmax |
2.064 |
1 |
0.15077 |
|
|
|
Significance codes: 0 '***' 0.001 '**' 0.01 '*' 0.05 '.' 0.1 ' ' 1
|
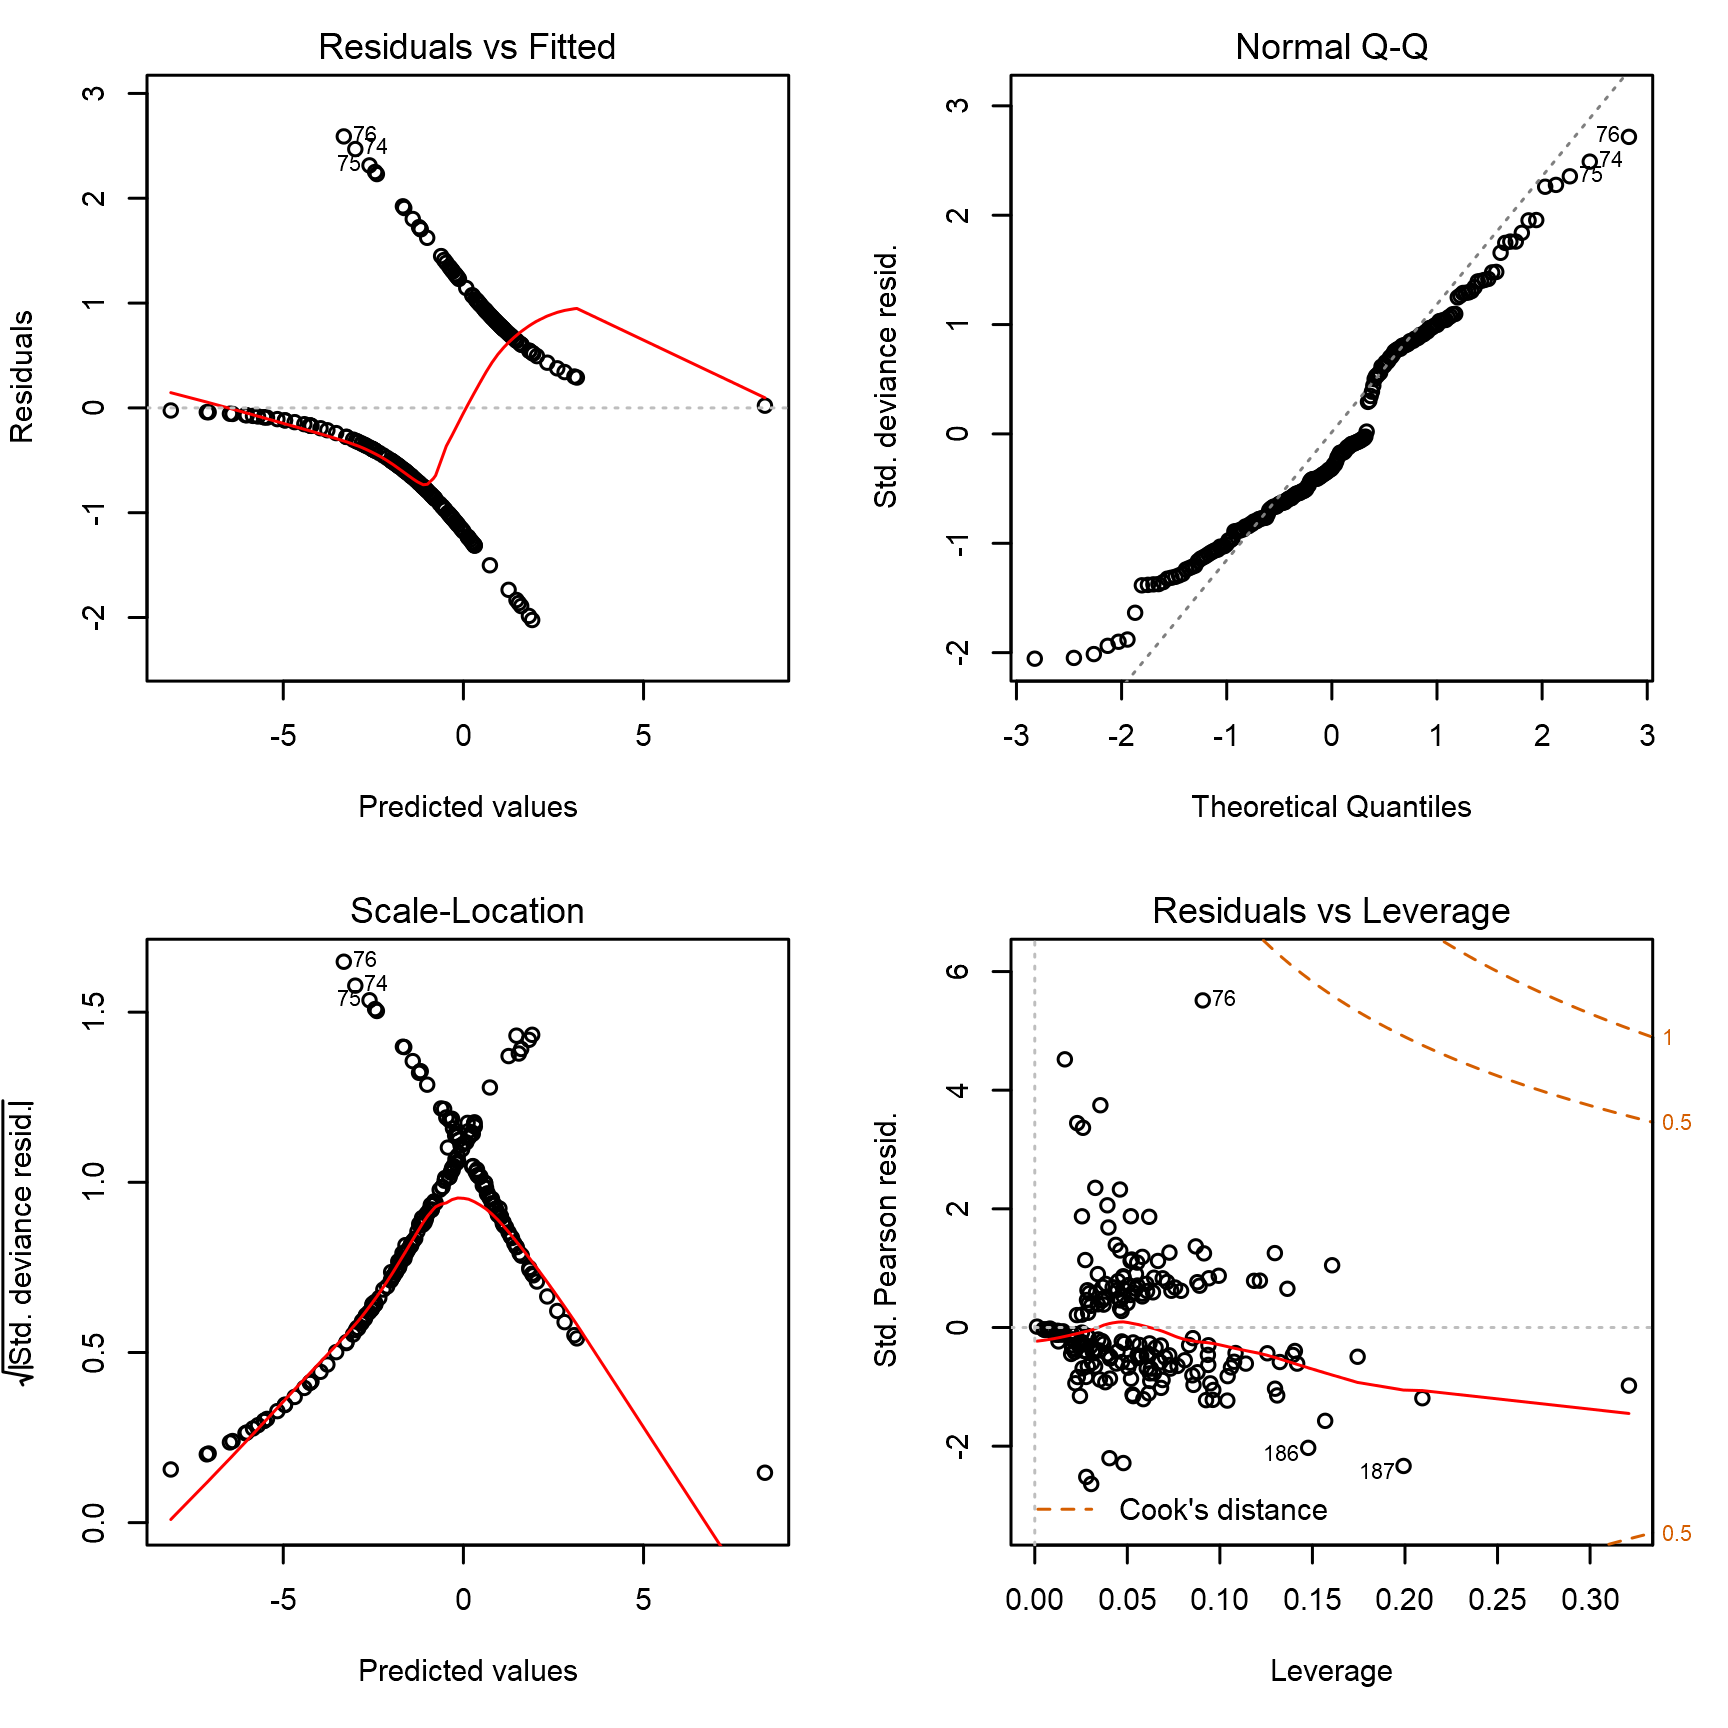
Basic Diagnostic Plots
Performance Diagnostic Plots with 95% Confidence Interval
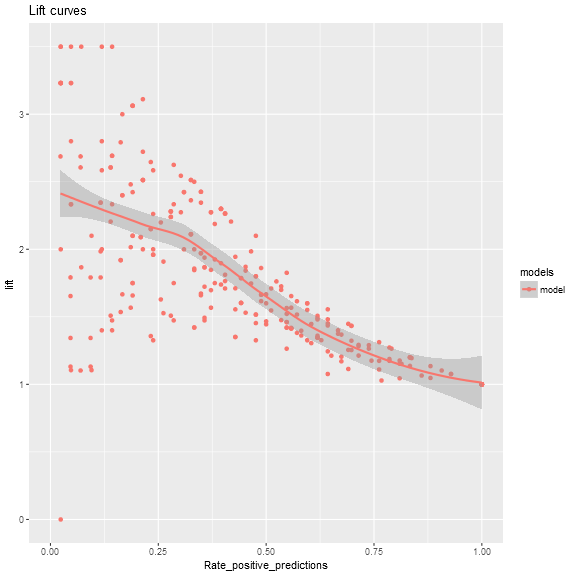
Performance Diagnostic Plots with 95% Confidence Interval
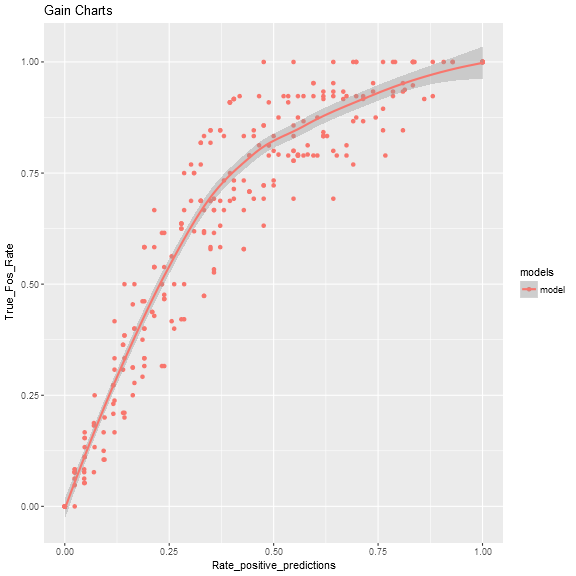
Performance Diagnostic Plots with 95% Confidence Interval
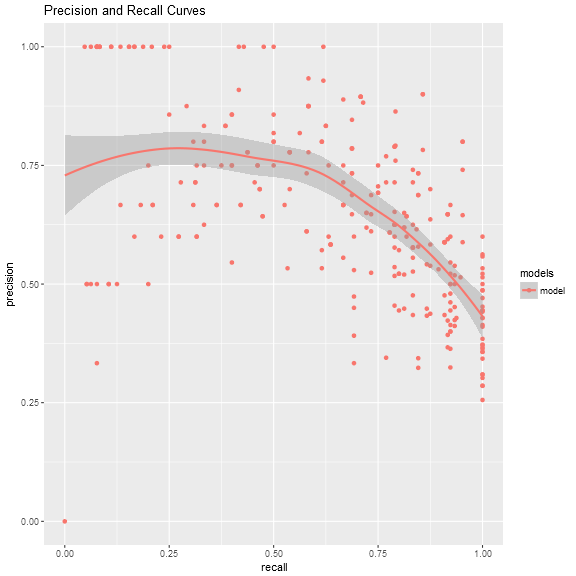
Performance Diagnostic Plots with 95% Confidence Interval

Model fit metrics (average per model)
| Avg_Accuracy_Class_1 |
Avg_Accuracy_Class_2 |
Avg_Accuracy_Overall |
Avg_AUC |
Avg_F1 |
| 0.837604 |
0.685144 |
0.776449 |
0.820450 |
0.692094 |