Report for Logistic Regression Model LR
Basic Summary
Call: glm(formula = pres.abs ~ distance + NoOfPools + meanmin, family = binomial("logit"), data = the.data)
Deviance Residuals:
| Min |
1Q |
Median |
3Q |
Max |
| -1.826 |
-0.801 |
-0.457 |
0.910 |
2.873 |
Coefficients:
|
|
Estimate |
Std. Error |
z value |
Pr(>|z|) |
|
| (Intercept) |
-4.6332538 |
1.1464898 |
-4.041 |
5e-05 |
*** |
| distance |
-0.0006007 |
0.0001731 |
-3.471 |
0.00052 |
*** |
| NoOfPools |
0.0251223 |
0.0080723 |
3.112 |
0.00186 |
** |
| meanmin |
1.3438184 |
0.3087004 |
4.353 |
1e-05 |
*** |
|
|
Significance codes: 0 '***' 0.001 '**' 0.01 '*' 0.05 '.' 0.1 ' ' 1
|
(Dispersion parameter for binomial taken to be 1 )
|
Null deviance: 279.99 on 211 degrees of freedom Residual deviance: 216.1 on 208 degrees of freedom
McFadden R-Squared: 0.2282, Akaike Information Criterion 224.1
Number of Fisher Scoring iterations: 6
Type II Analysis of Deviance Tests
|
Response: pres.abs
|
|
|
LR Chi-Sq |
DF |
Pr(>Chi-Sq) |
|
| distance |
19.976 |
1 |
1e-05 |
*** |
| NoOfPools |
11.138 |
1 |
0.00085 |
*** |
| meanmin |
21.066 |
1 |
4.43e-06 |
*** |
|
|
Significance codes: 0 '***' 0.001 '**' 0.01 '*' 0.05 '.' 0.1 ' ' 1
|
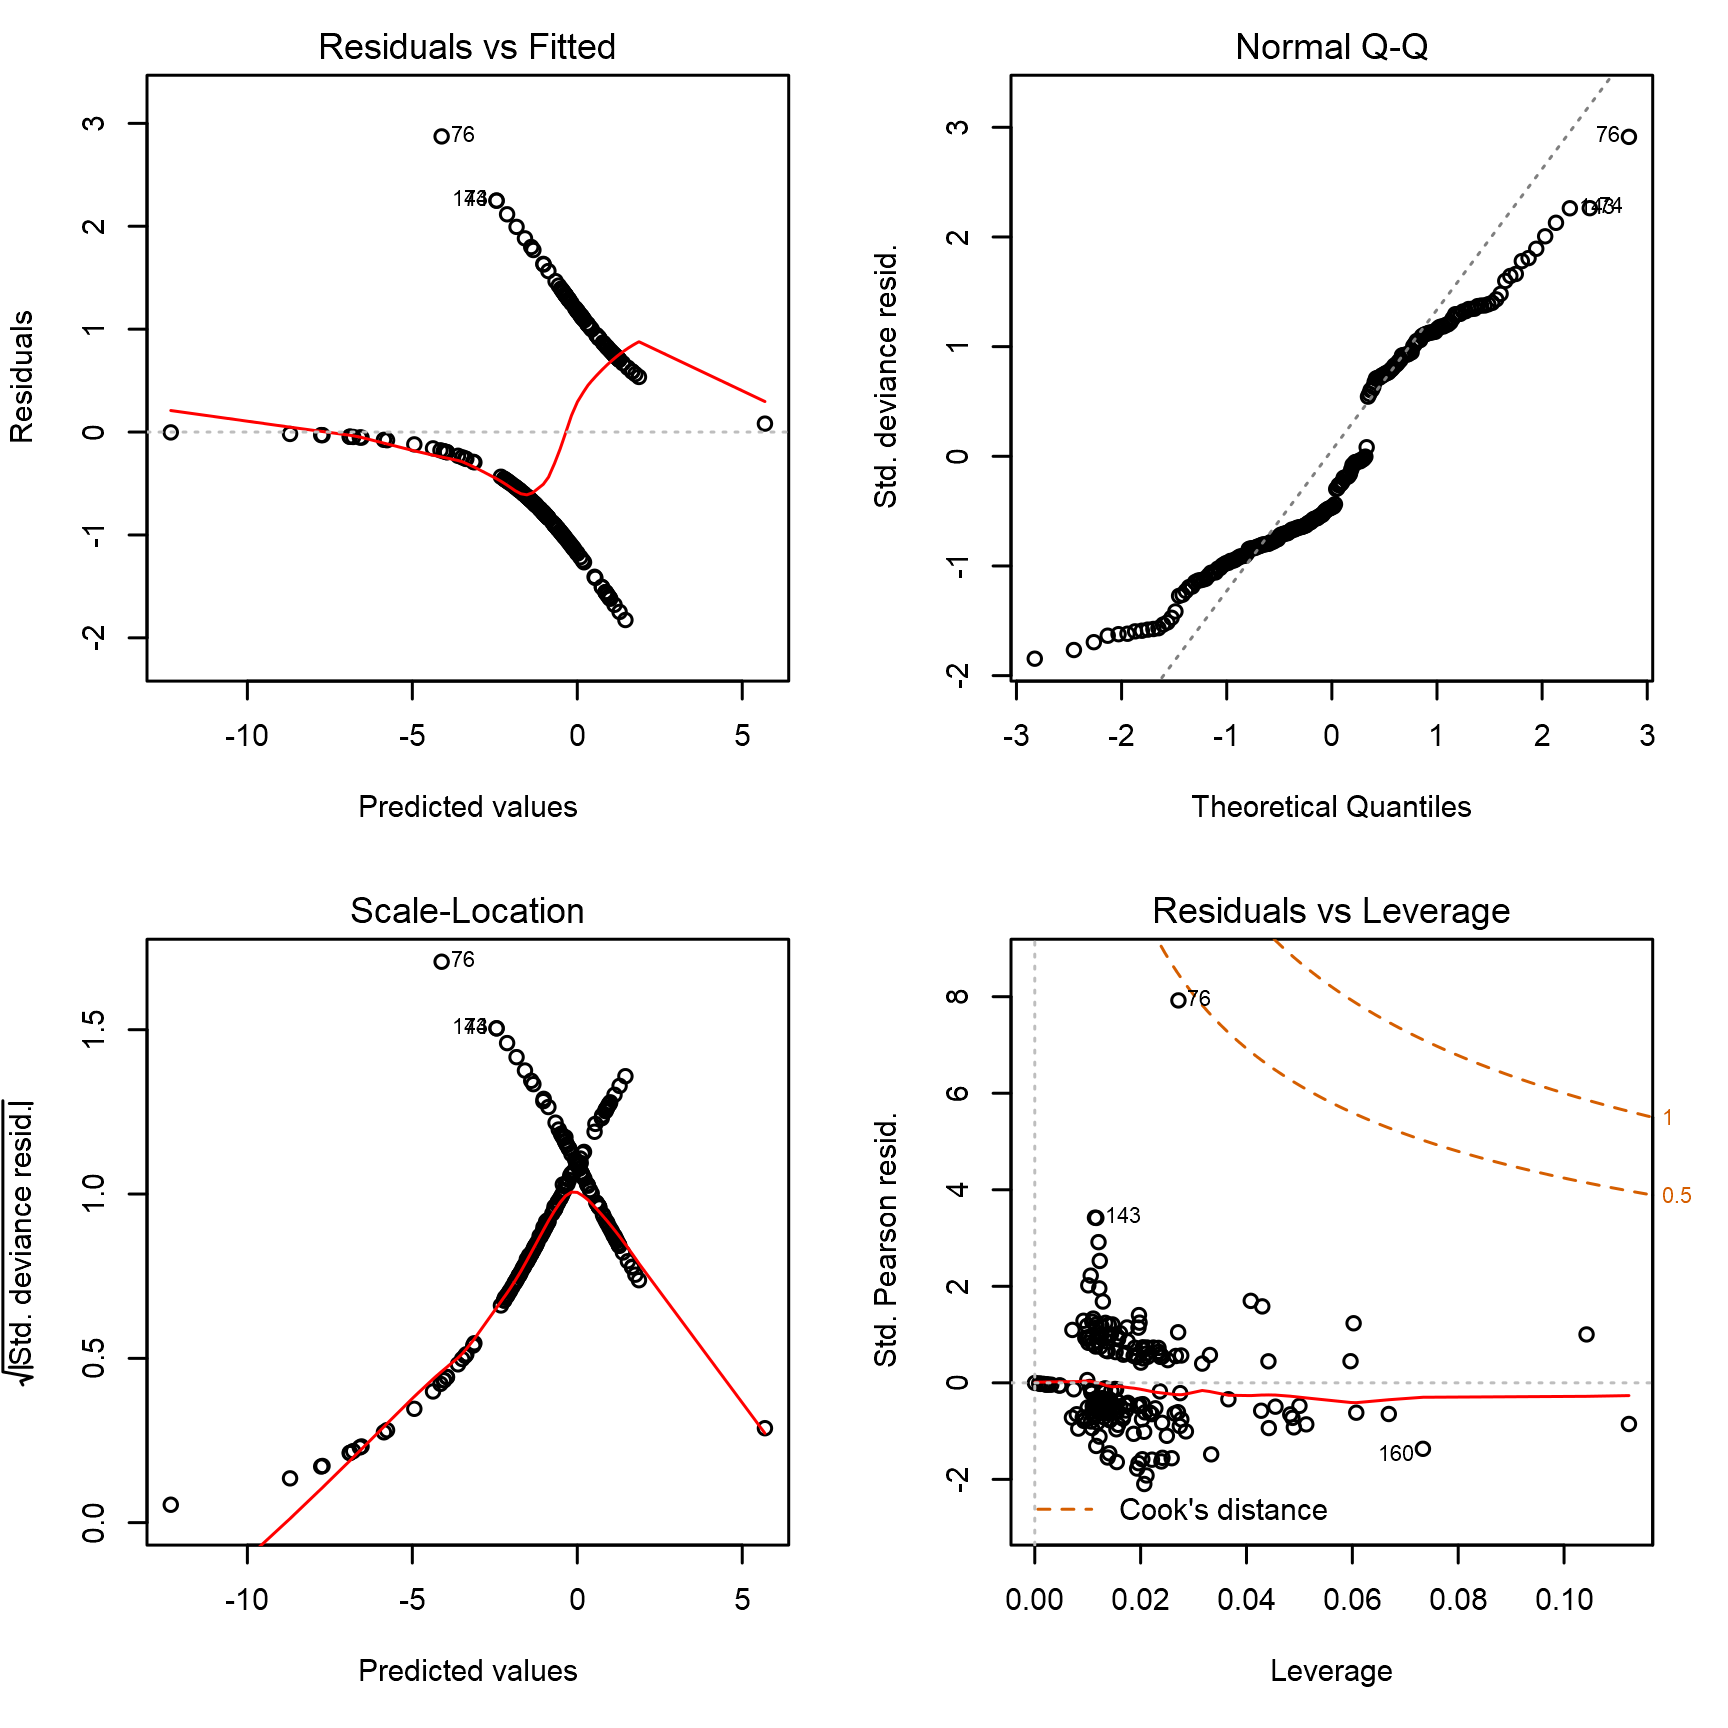
Basic Diagnostic Plots
Performance Diagnostic Plots with 95% Confidence Interval
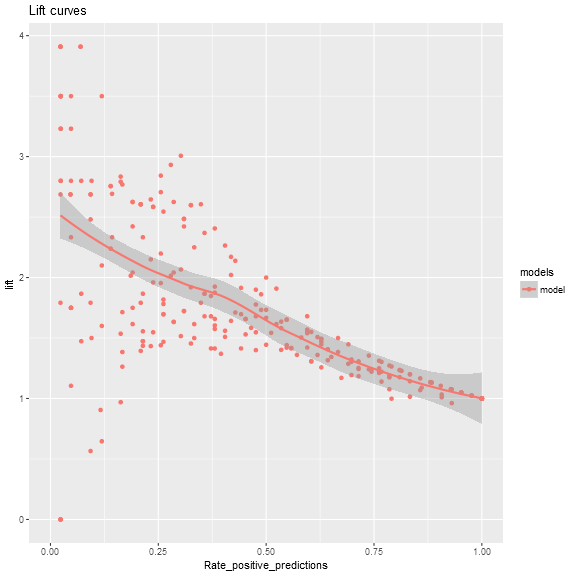
Performance Diagnostic Plots with 95% Confidence Interval
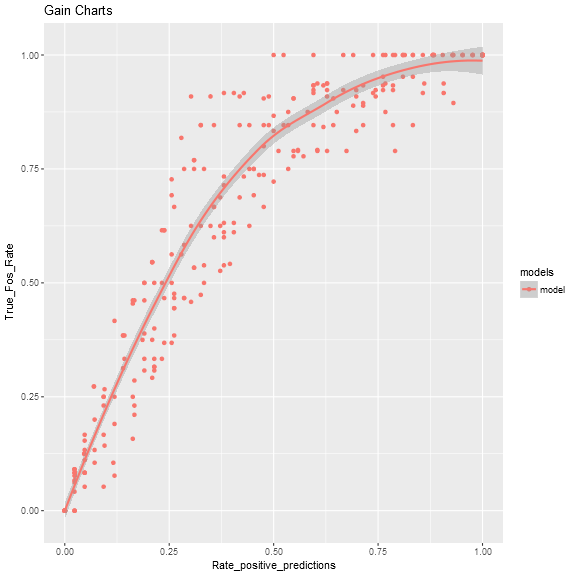
Performance Diagnostic Plots with 95% Confidence Interval
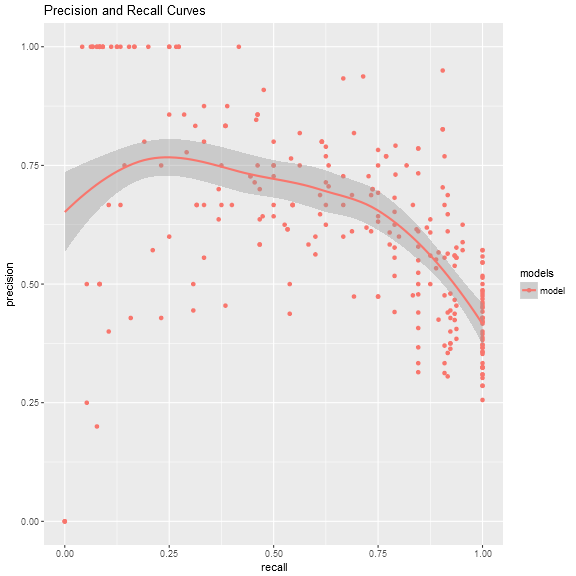
Performance Diagnostic Plots with 95% Confidence Interval
Model fit metrics (average per model)
| Avg_Accuracy_Class_1 |
Avg_Accuracy_Class_2 |
Avg_Accuracy_Overall |
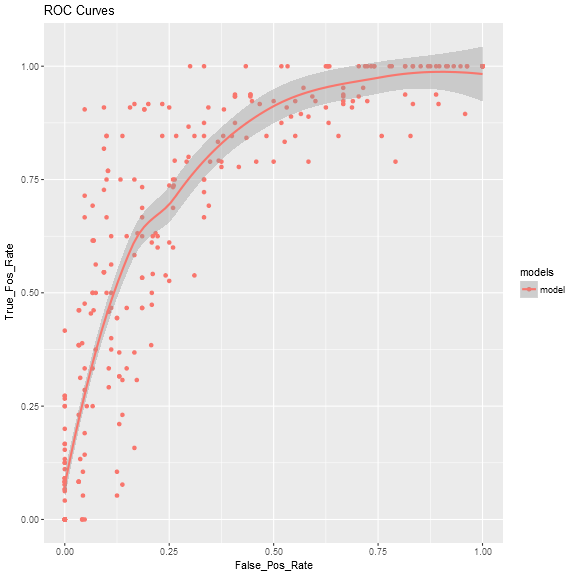
Avg_AUC |
Avg_F1 |
| 0.849466 |
0.603223 |
0.749945 |
0.810862 |
0.639084 |