Viewing Data in SAS
Once we have the data in SAS we would like to view it to make sure everything is alright. To do this we use PROC PRINT. If you haven't done so, go ahead and import the sample data into the SAS as described here.
Now type the following in the Editor window and press F3. Note how we name the data file in the library.datasetname format.
									PROC PRINT DATA = tutorial.lecture1;

									RUN;
Results window will show the data. Note that most of the time your data has hundreds, if not thousands, of rows and it is not practical to see the whole data. In that case it is beneficial to limit the number of rows printed. To do this we can use the OBS=numberofrows argument in PROC PRINT statement. Following command will only print the first 10 rows in your data.
									PROC PRINT DATA = tutorial.lecture1 (OBS=10);

									RUN;
Tips and Tricks
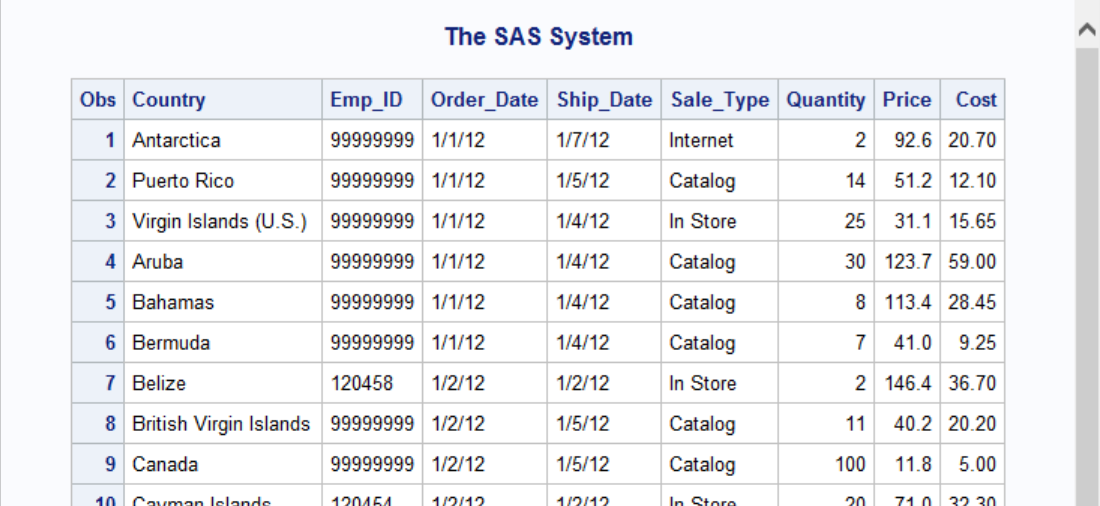
We will use a new dataset to demonstrate PROC PRINT. You can download the data set from here. Copy the dataset to tutorial library you created in first lecture. Here is what this data looks like:
| Country | Emp_ID | Order_Date | Ship_Date | Sale_Type | Quantity | Price | Cost |
|---|---|---|---|---|---|---|---|
| Antarctica | 1E+08 | 1/1/2012 | 1/7/2012 | Internet | 2 | 92.6 | 20.7 |
| Puerto Rico | 1E+08 | 1/1/2012 | 1/5/2012 | Catalog | 14 | 51.2 | 12.1 |
| Virgin Islands (US) | 1E+08 | 1/1/2012 | 1/4/2012 | In Store | 25 | 31.1 | 15.65 |
| Aruba | 1E+08 | 1/1/2012 | 1/4/2012 | Catalog | 30 | 123.7 | 59 |
| Bahamas | 1E+08 | 1/1/2012 | 1/4/2012 | Catalog | 8 | 113.4 | 28.45 |
| Bermuda | 1E+08 | 1/1/2012 | 1/4/2012 | Catalog | 7 | 41 | 9.25 |
| Belize | 120458 | 1/2/2012 | 1/2/2012 | In Store | 2 | 146.4 | 36.7 |
| British Virgin Islands | 1E+08 | 1/2/2012 | 1/5/2012 | Catalog | 11 | 40.2 | 20.2 |
| Canada | 1E+08 | 1/2/2012 | 1/5/2012 | Catalog | 100 | 11.8 | 5 |
| Cayman Islands | 120454 | 1/2/2012 | 1/2/2012 | In Store | 20 | 71 | 32.3 |
| Costa Rica | 1E+08 | 1/2/2012 | 1/6/2012 | Internet | 31 | 53 | 26.6 |
| Cuba | 121044 | 1/2/2012 | 1/2/2012 | Internet | 12 | 42.4 | 19.35 |
| Dominican Republic | 121040 | 1/2/2012 | 1/2/2012 | Internet | 13 | 48 | 23.95 |
| El Salvador | 1E+08 | 1/2/2012 | 1/6/2012 | Catalog | 21 | 266.4 | 66.7 |
| Guatemala | 120931 | 1/2/2012 | 1/2/2012 | In Store | 13 | 144.4 | 65.7 |
| Haiti | 121059 | 1/2/2012 | 1/2/2012 | Internet | 5 | 47.9 | 23.45 |
| Honduras | 120455 | 1/2/2012 | 1/2/2012 | Internet | 20 | 66.4 | 30.25 |
| Jamaica | 1E+08 | 1/2/2012 | 1/4/2012 | In Store | 23 | 169.8 | 38.7 |
| Mexico | 120127 | 1/2/2012 | 1/2/2012 | In Store | 30 | 211.8 | 33.65 |
| Montserrat | 120127 | 1/2/2012 | 1/2/2012 | In Store | 19 | 184.2 | 36.9 |
| Nicaragua | 120932 | 1/2/2012 | 1/2/2012 | Internet | 16 | 122 | 28.75 |
| Panama | 1E+08 | 1/2/2012 | 1/6/2012 | Internet | 20 | 88.2 | 38.4 |
| Saint Kitts/Nevis | 1E+08 | 1/2/2012 | 1/6/2012 | Internet | 20 | 41.4 | 18 |
| St. Helena | 120360 | 1/2/2012 | 1/2/2012 | Internet | 19 | 94.7 | 47.45 |
| St. Pierre/Miquelon | 120842 | 1/2/2012 | ####### | Internet | 16 | 103.8 | 47.25 |
| Turks/Caicos Islands | 120372 | 1/2/2012 | 1/2/2012 | Internet | 10 | 57.7 | 28.95 |
| United States | 120372 | 1/2/2012 | 1/2/2012 | Internet | 20 | 88.2 | 38.4 |
To display this dataset we use PROC PRINT (don't forget to press F3 to run this code):
									PROC PRINT DATA = tutorial.lecture2;

									RUN;
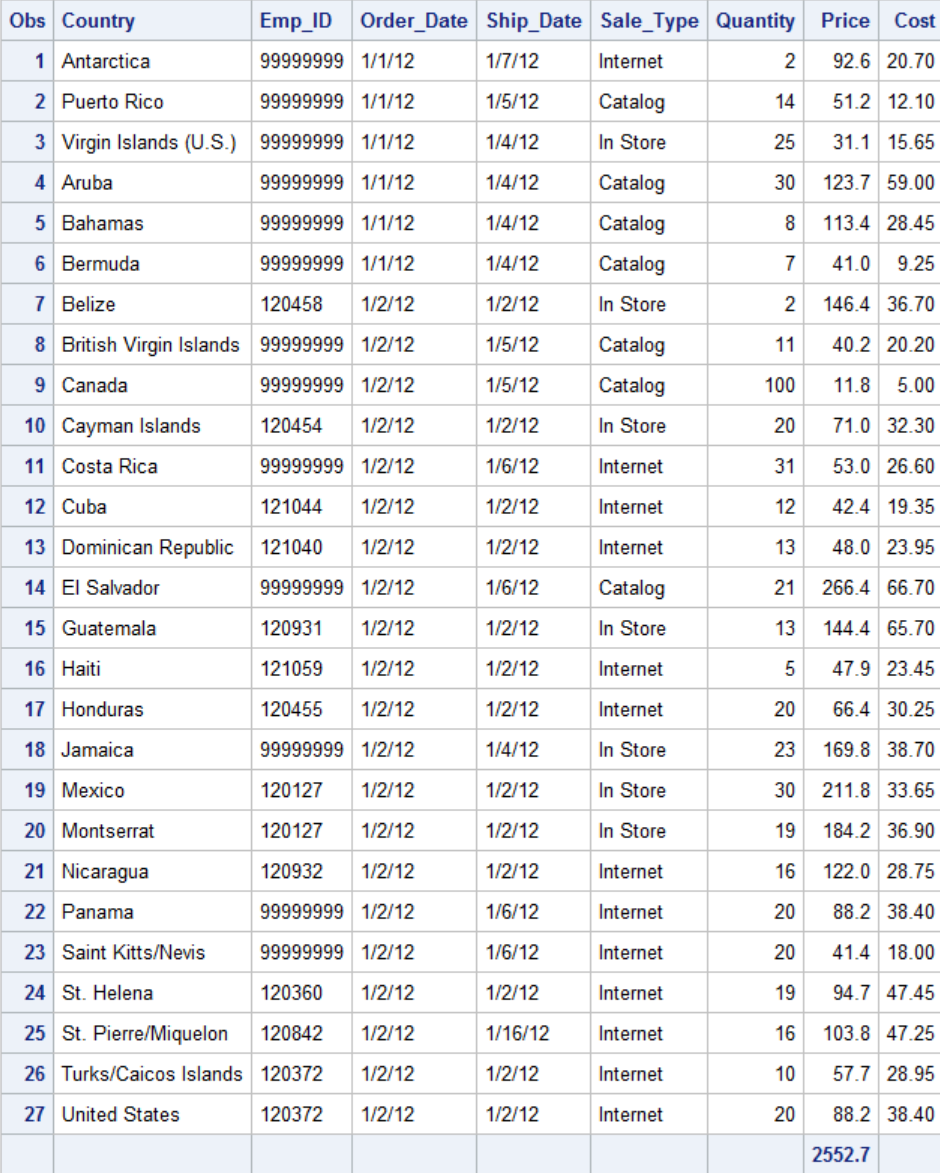
This is how PROC PRINT displays the data:
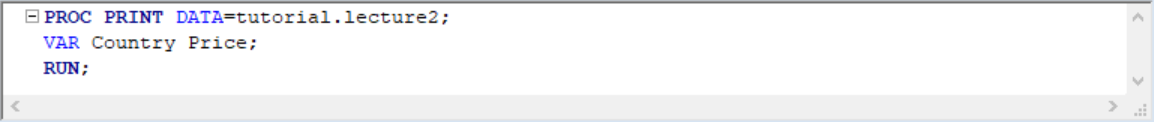
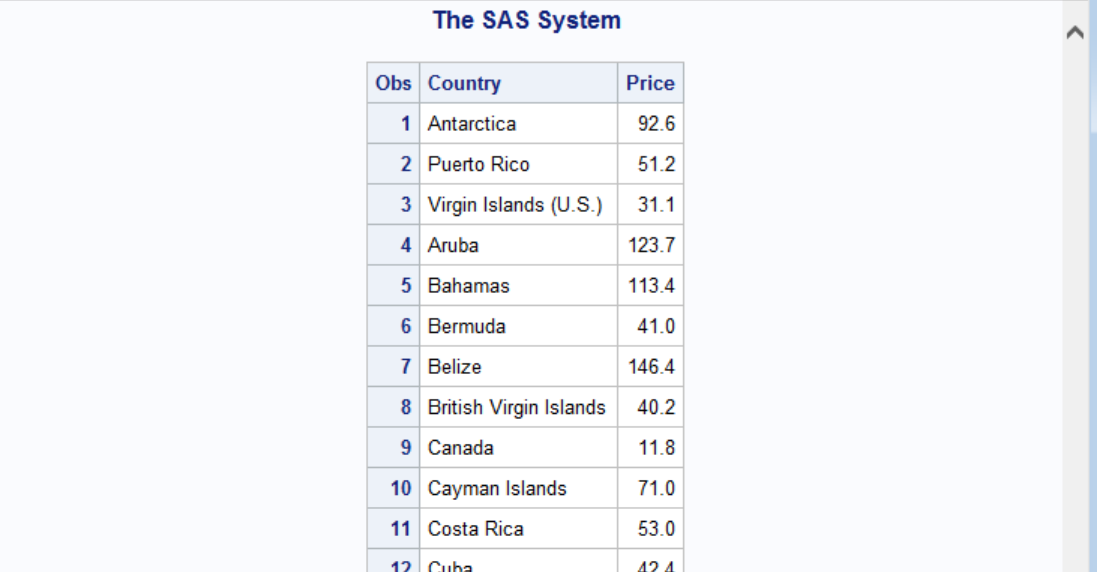
Printing only certain columns
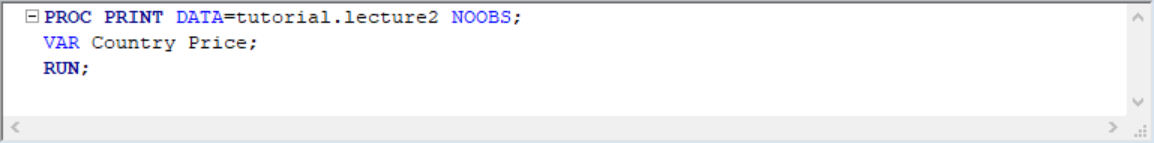
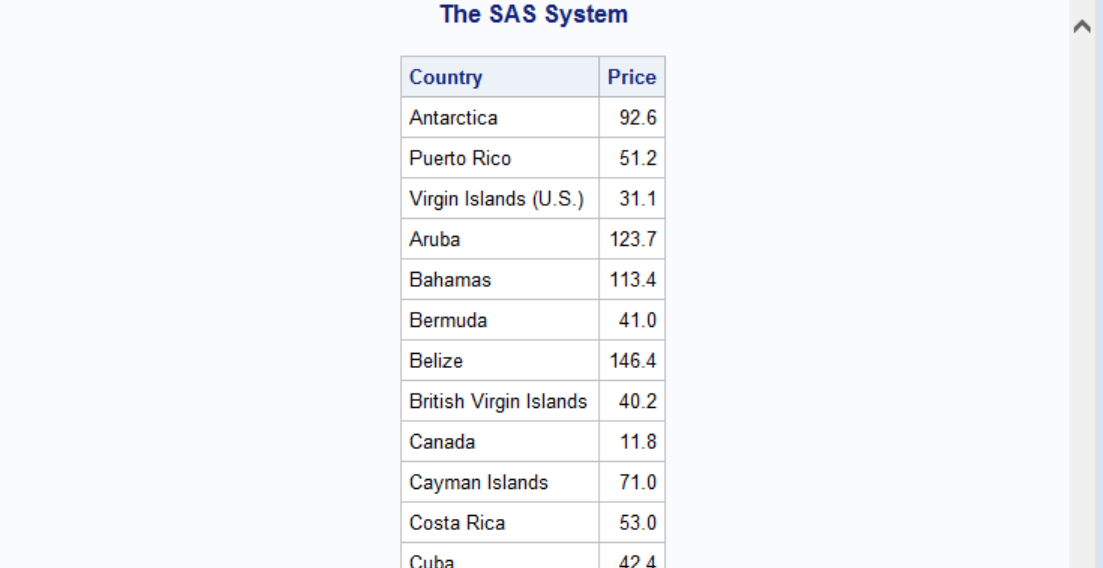
To print only certain variables we use the VAR statement:
If you don't want to see observation number printed:
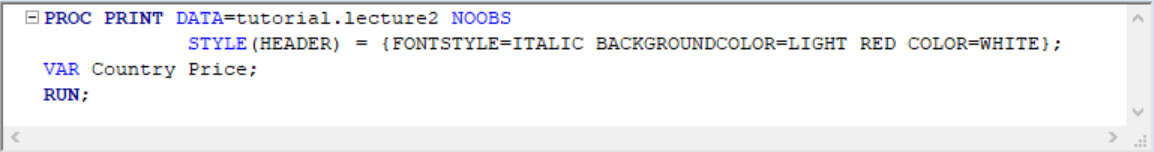
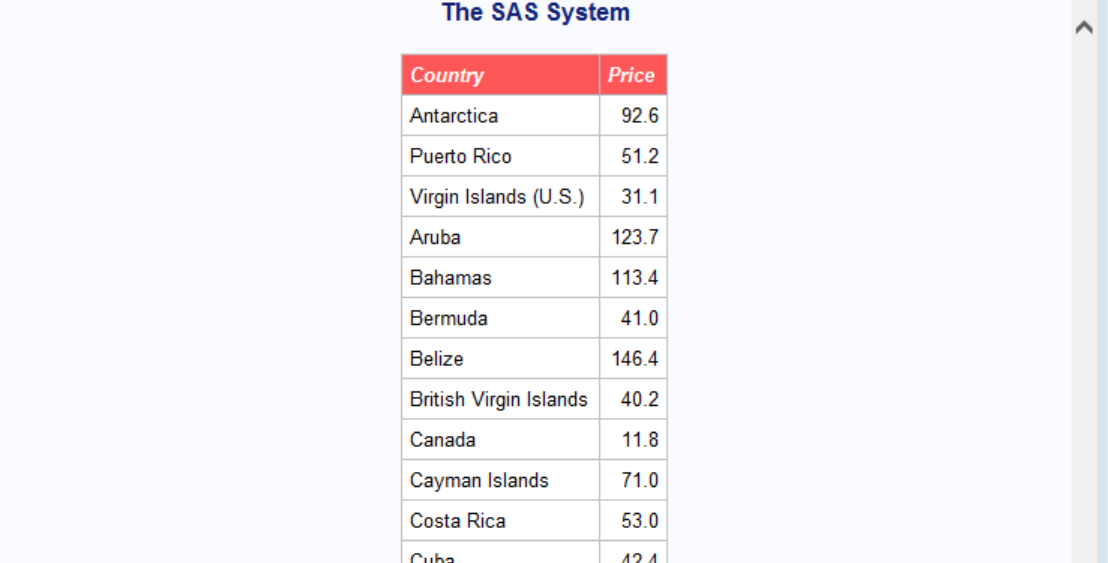
Styling header
Headers can be styled with STYLE keyword within PROC IMPORT statement:
Adding SUMs
PRINT also allows some basic summary functionality of datasets such as SUM. For example, following code calculates the total for price:
									PROC PRINT DATA = tutorial.lecture2;

									SUM price;
									RUN;
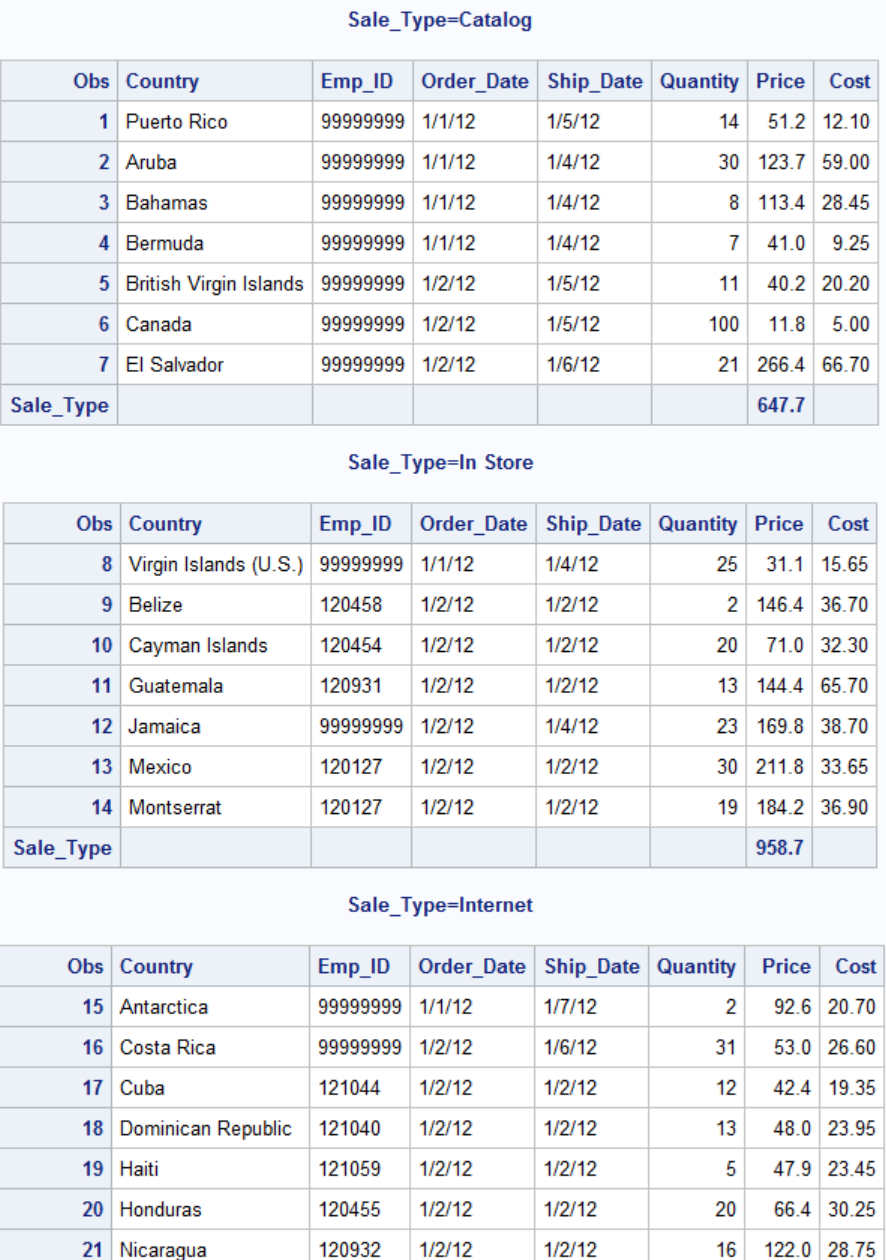
We can also calculate subtotals, for example for sale_type, but doing this requires sorting the data beforehand with PROC SORT:
									PROC SORT DATA = tutorial.lecture2;

									BY sale_type;

									RUN;


									PROC PRINT DATA = tutorial.lecture2;

									SUM price;

									BY sale_type;

									RUN;
Prev Post
Importing Data

Lrrr
Senior blog writer
Lrrr, ruler of the planet Omicron Persei 8, is a middle-aged Omicronian man with a bad temper and soft spots for the conquering of planets and 20th century television.
Popular Posts

Space The Final Frontier
02 Hours ago

The Amazing Hubble
02 Hours ago

Astronomy Or Astrology
02 Hours ago

Asteroids telescope
02 Hours ago

Leave a Comment