Browsing Data
Alteryx makes browsing data easy with its "Browse" module. This module, in particular, is great at creating quick histograms.
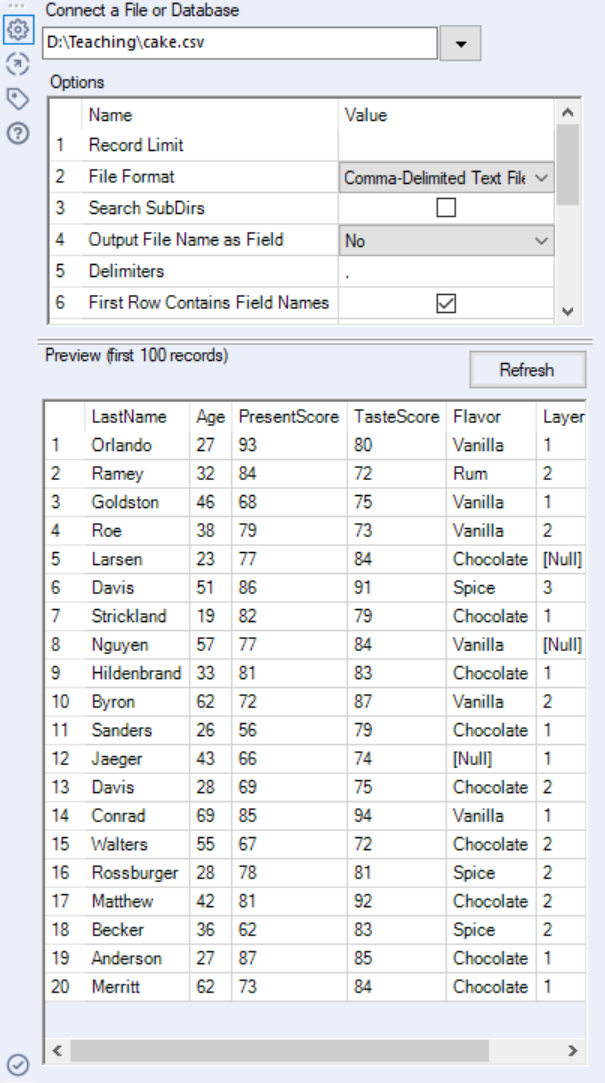
You can download the sample data from here. This dataset is from a cake-baking contest: each participant's last name, age, score for presentation, score for taste, cake flavor, and number of cake layers. The number of cake layers is missing for two observations. The cake flavor is missing for another observation.
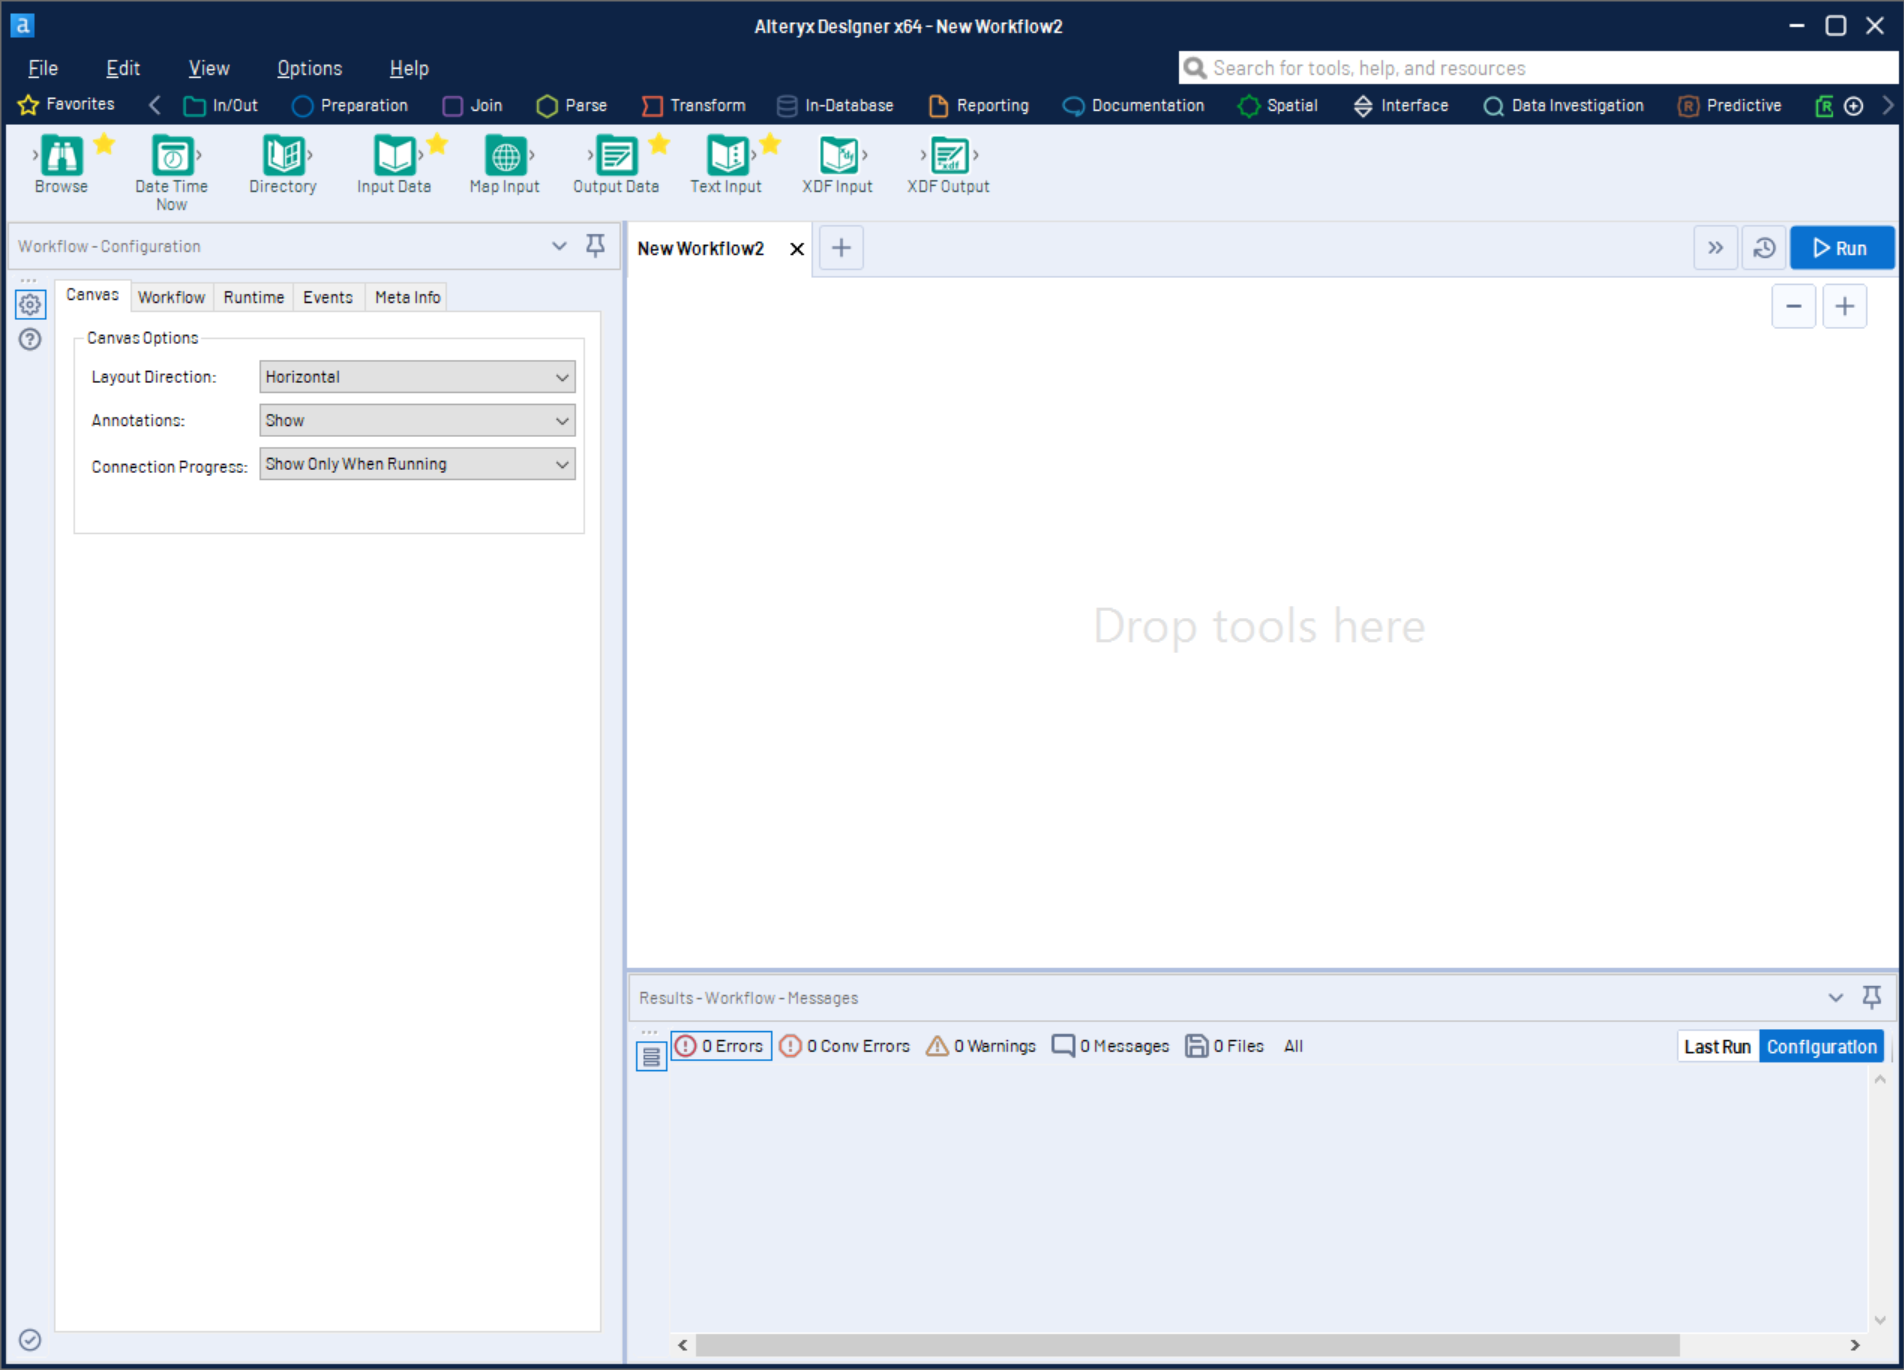
Here is what Alteryx Designer workspace looks like:
In order to analyze our data set, we need to import it. To do this we need to use "Input Data" module. In the toolbar just under the menu, click "In/Out" (see below)

This will open a group of module shortcuts as seen below. Now drag and drop Input Data from the tool palette into the design window. Next do the same for the Browse module.

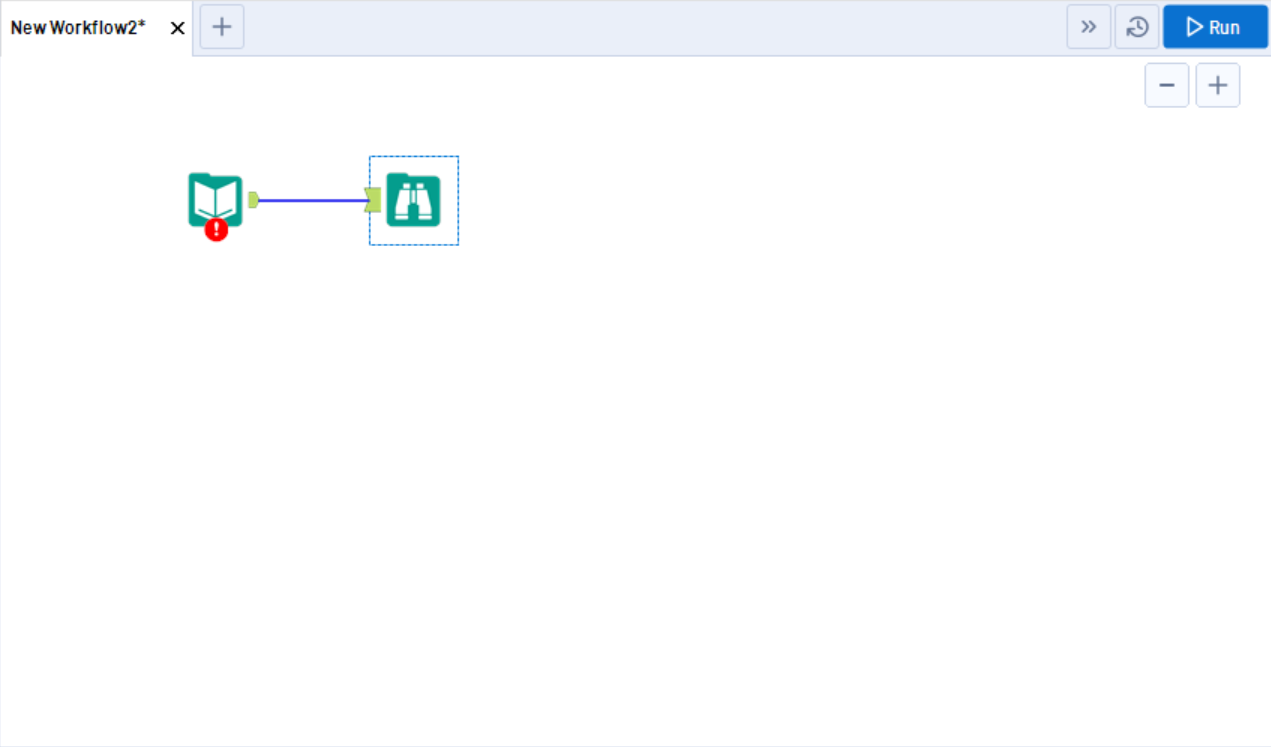
Click the Input Data module in the design window. You will see configuration options for this module on the right (this is called configuration window).
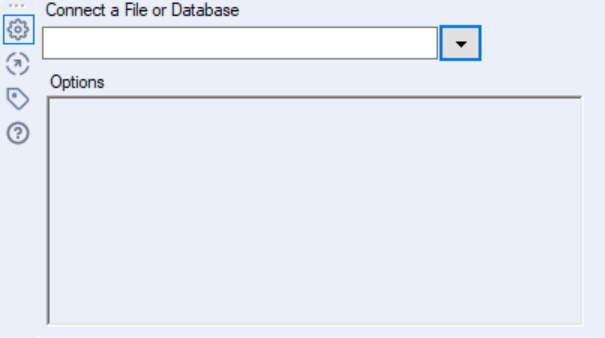
Click File under the dropdown menu and select the "cake.csv" file. A preview will appear under configuration window.
Click Run on top-right of the design window. You will see a result window like this:

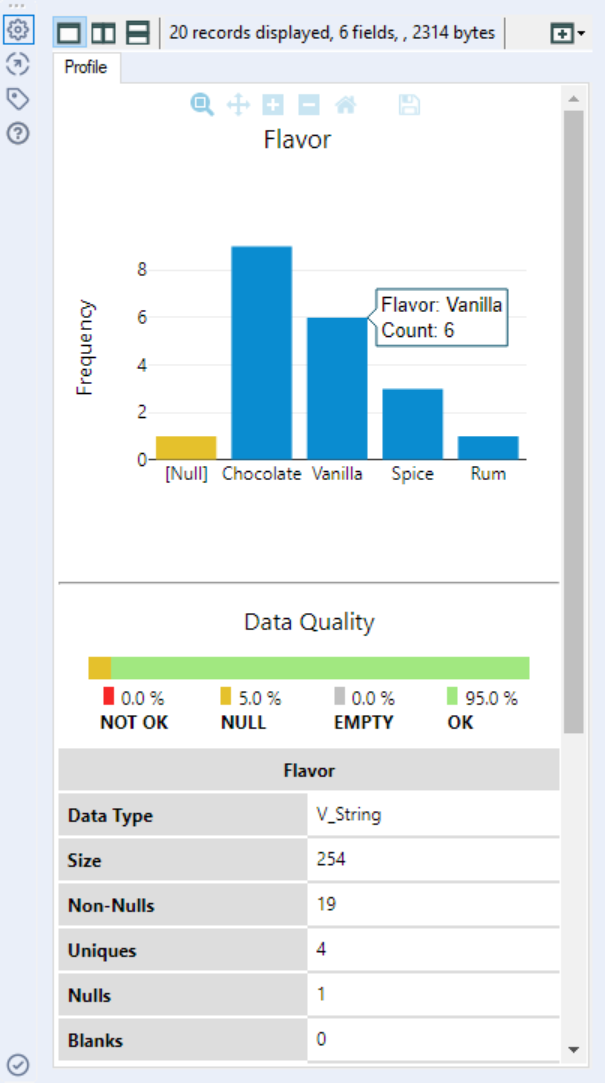
Click anywhere in the column "Flavor". You will see a histogram of "Flavor" on the left under preview.
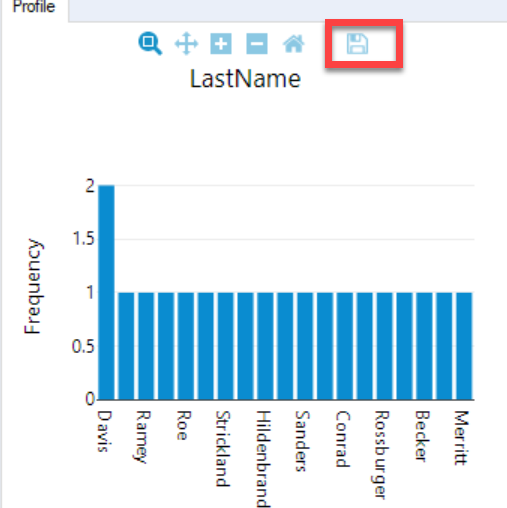
You can hover over the histogram and save it as png, as shown below.

Lrrr
Senior blog writer
Lrrr, ruler of the planet Omicron Persei 8, is a middle-aged Omicronian man with a bad temper and soft spots for the conquering of planets and 20th century television.
Popular Posts

Space The Final Frontier
02 Hours ago

The Amazing Hubble
02 Hours ago

Astronomy Or Astrology
02 Hours ago

Asteroids telescope
02 Hours ago

Leave a Comment