Logistic Regression
Logistic model (or logit model) is a widely used statistical model that, in its basic form, uses a logistic function to model a binary dependent variable; many more complex extensions exist. In regression analysis, logistic regression (or logit regression) is estimating the parameters of a logistic model; it is a form of binomial regression. Mathematically, a binary logistic model has a dependent variable with two possible values, such as pass/fail, win/lose, alive/dead or healthy/sick; these are represented by an indicator variable, where the two values are labeled "0" and "1".
Logistic regression is used in various fields, including machine learning, most medical fields, and social sciences. For example, the Trauma and Injury Severity Score (TRISS), which is widely used to predict mortality in injured patients, was originally developed by Boyd et al. using logistic regression. Many other medical scales used to assess severity of a patient have been developed using logistic regression.Logistic regression may be used to predict the risk of developing a given disease (e.g. diabetes; coronary heart disease), based on observed characteristics of the patient (age, sex, body mass index, results of various blood tests, etc.). It is also used in marketing applications such as prediction of a customer's propensity to purchase a product or halt a subscription, etc. In economics it can be used to predict the likelihood of a person's choosing to be in the labor force, and a business application would be to predict the likelihood of a homeowner defaulting on a mortgage. Conditional random fields, an extension of logistic regression to sequential data, are used in natural language processing.
Example: Frogs
Description: This data frame gives the distribution of the Southern Corroboree frog, which occurs in the Snowy Mountains area of New South Wales, Australia.
pres.abs: 0 = frogs were absent, 1 = frogs were present
northing: reference point.
easting: reference point.
altitude: altitude in meters.
distance: distance in meters to nearest extant population.
noofpools: number of potential breeding pools.
noofsites: number of potential breeding sites within a 2 km radius.
avrain: mean rainfall for Spring period.
meanmin: mean minimum Spring temperature.
meanmax: mean maximum Spring temperature.
Source: https://vincentarelbundock.github.io/Rdatasets/doc/DAAG/frogs.html
Download the data from here
Task: What are the best parameters for existence of frogs?
Let's begin our first shot at our logistic model. At first, we will include all the possible independent variables:
Model I
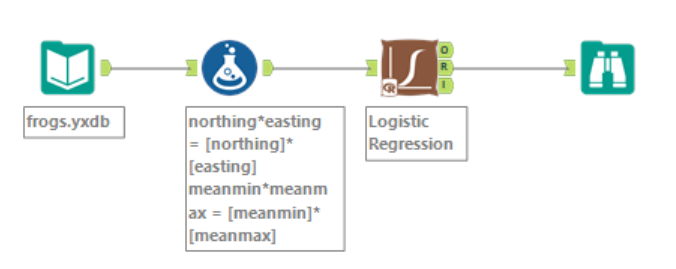
Here is what out workflow looks like.


See the results here.
Based on our p-values, distance, noofpools and meanmin are the relevant parameters. So we shall drop the other parameters and we're done, right? Unfortunately not. What this results tells us that distance, noofpools and meanmin are the most important variables within the set of variables in our model. That is, if this combination of variables (variables specified after MODEL statement) are the best there is then yes, we're done. But what about interaction terms? We haven't included them in our model. To include them in our model, we can specify them as var1 var2 var1*var2 or simply var1|var2. Let's include northing|easting and meanmin|meanmax. Before that note our AIC measure under Model Fit Statistics; the lower this number the better. AIC for our first model 215.7.
Model II


See the results here.
Allright, so far our results are similar to the previous one - distance, noofpools and meanmin are the relevant parameters, again. Our AIC is 217.3 higher than our previous model. Therefore we can discard our current model and go back to the first model and remove unrelevant variables.
Model III
See the results here.
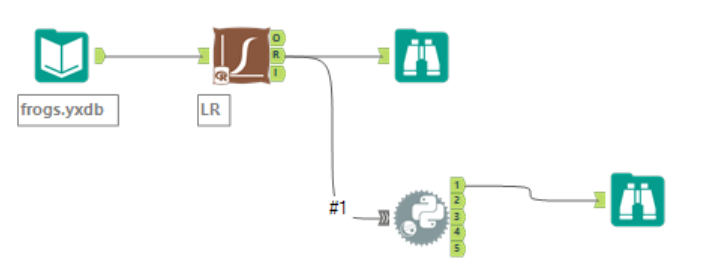
Unfortunately Alteryx does not have a built-in method for calculating odds ratios. Luckily Alteryx has a node called Python which can help us to calculate the odd ratios ourselves. First, connect Pyhton input node to the 'R' output of our Logistic Regression Model as shown below. Then copy the following code to the node.
#################################
from ayx import Package
import re
import numpy as np
import pandas as pd
from ayx import Alteryx

#################################
df = Alteryx.read("#1")
addRegex = re.compile('(?:column0 Rule0" style="" >)([A-Za-z0-9]{1,15})', re.DOTALL)
var = re.findall('(?:column0 Rule0" style="" >)([A-Za-z0-9()]{1,15})', df.loc[6,'Report'], re.DOTALL)
valstr = re.findall('(?:column1 Rule0" style="" >)([ -.A-Za-z0-9]{1,15})', df.loc[6,'Report'], re.DOTALL)
valflt = []
valflt.clear()

#################################
for v in valstr:
    valflt.append(float(v))

#################################
coef = pd.DataFrame(valflt, var, columns=['Coefficient'])
coef['OddsRatio'] = np.exp(coef.Coefficient)
Alteryx.write(coef, 1)


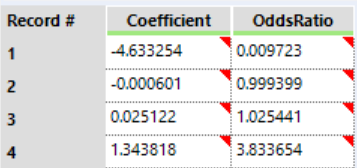
For distance, every 1 unit increase in distance results in (0.999-1=-0.001) 0.1% decreased chance of finding frogs. Similarly, every additional noofpools results in (1.025-1=0.025) 2.5% increased chance and every additional meanmin results in (3.834-1=2.834) 283% increased chance of finding frogs. Let's graphically verify these via Heat Plot node:


Leave a Comment