Student's t-test
The t-test is any statistical hypothesis test in which the test statistic follows a Student's t-distribution under the null hypothesis. A t-test is most commonly applied when the test statistic would follow a normal distribution if the value of a scaling term in the test statistic were known. When the scaling term is unknown and is replaced by an estimate based on the data, the test statistics (under certain conditions) follow a Student's t distribution. The t-test can be used, for example, to determine if two sets of data are significantly different from each other. a t test is appropriate when the independent variable is defined as having two categories and the dependent variable is quantitative (e.g., Do males and females [IV] have significantly different SAT scores [DV]?).
One sample t-test
In one sample t-test, we test whether a population mean is equal to a hypothesized value. Let's look at q-tip data (download it here). This dataset represents the number of q-tips in each box. We expect 100 q-tips in each box and want to make sure this is so with 99% confidence level.
We can test our hypothesis with PROC TTEST:

Here we call the PROC TTEST procedure with options H0=100 (expected mean is equal to 100) and ALPHA=0.01 (99% confidence interval).

Our 99% confidence interval is between 99.94 and 100.5. p-value for t-test is 0.0398 > 0.01 therefore we can not claim that each box contains 100 q-tips at the 0.01 level.
Two-Sample t-test
In two-sample t-test, means of two different groups are compared. The main hypothesis is that they are equal.
Our sample data is from here. Data set contains 144 adult (over 2 kg in weight) cats used for experiments with the drug digitalis had their heart weight recorded. 47 of the cats were female and 97 were male. Let's see if female and male heart weights are equal. Download the data from here.


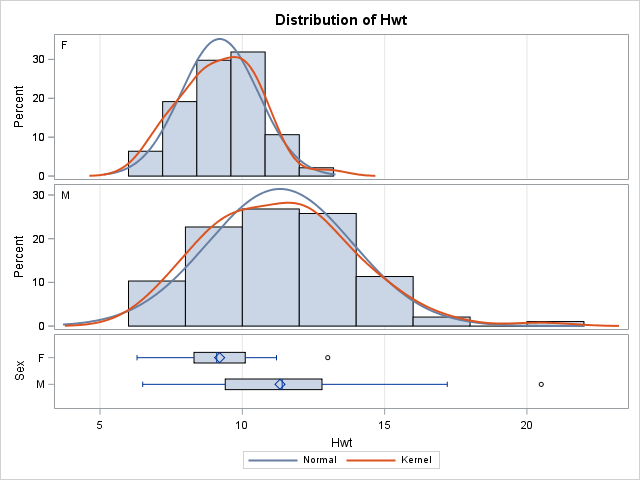
There are two p-values for the t-test; one for assuming equal variances (Pooled) and another for unequal variances (Satterthwaite). To see whether variances are equal, we look at the Folded F test. Since p-value for Folded F test is less than 0.05, we can assume variances are equal therefore we use Pooled method to determine the p-value of our t-test. p-value for Pooled method t-test is less than 0.05 thus we conclude that means of female and male populations are not equal. This is also visually apparent from the distribution graph above.
Paired t-test
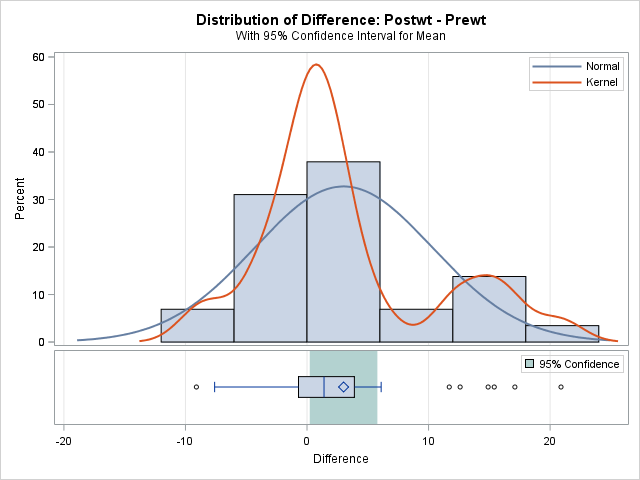
Paired t-test compares two repeated measures (before and after). For example, we can test the effect of CBT (Cognitive Behavioral Therapy) on weight gain in anorexia patients. Our data set includes 2 columns; Prewt, weight before treatment and Postwt, weight after treatment (Source:https://vincentarelbundock.github.io/Rdatasets/doc/MASS/anorexia.html). Download the data from here.


p-value for the paired t-test is 0.035 therefore we can conclude that the post weight is sufficiently different than the pre-weight.
Example: CD4 Counts for HIV-Positive Patients
Description: CD4 cells are carried in the blood as part of the human immune system. One of the effects of the HIV virus is that these cells die. The count of CD4 cells is used in determining the onset of full-blown AIDS in a patient. In this study of the effectiveness of a new anti-viral drug on HIV, 20 HIV-positive patients had their CD4 counts recorded and then were put on a course of treatment with this drug. After using the drug for one year, their CD4 counts were again recorded. The aim of the experiment was to show that patients taking the drug had increased CD4 counts which is not generally seen in HIV-positive patients.
| baseline | oneyear |
| 2.12 | 2.47 |
| 4.35 | 4.61 |
| 3.39 | 5.26 |
| 2.51 | 3.02 |
| 4.04 | 6.36 |
| 5.1 | 5.93 |
| 3.77 | 3.93 |
| 3.35 | 4.09 |
| 4.1 | 4.88 |
| 3.35 | 3.81 |
| 4.15 | 4.74 |
| 3.56 | 3.29 |
| 3.39 | 5.55 |
| 1.88 | 2.82 |
| 2.56 | 4.23 |
| 2.96 | 3.23 |
| 2.49 | 2.56 |
| 3.03 | 4.31 |
| 2.66 | 4.37 |
| 3 | 2.4 |
baseline: The CD4 counts (in 100's) on admission to the trial.
oneyear: The CD4 counts (in 100's) after one year of treatment with the new drug.
Source: https://vincentarelbundock.github.io/Rdatasets/doc/boot/cd4.html
Download the data from here
Task: Test whether the treatment is effective or not.
This is a clear example of paired t-test where we can test before and after.

Below is the paired profile graph showing individual profiles along with them mean. A clear change in the mean can be seen. An alternative graphical conclusion can also be drawn from an agreement graph which is below as well.


Let's come to the test results:
| N | Mean | Std Dev | Std Err | Minimum | Maximum |
|---|---|---|---|---|---|
| 20 | -0.8050 | 0.8017 | 0.1793 | -2.3200 | 0.6000 |
| Mean | 95% CL Mean | Std Dev | 95% CL Std Dev | ||
|---|---|---|---|---|---|
| -0.8050 | -1.1802 | -0.4298 | 0.8017 | 0.6097 | 1.1709 |
| DF | t Value | Pr > |t| |
|---|---|---|
| 19 | -4.49 | 0.0003 |
As can be seen from the very low p-value above, the test is highly significant therefore we can conclude that treatment has an effect on cd4 count.


Leave a Comment