Interpolation
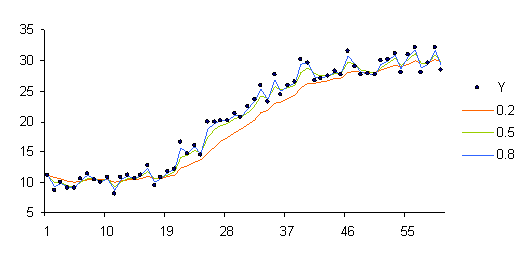
Interpolation is a method of constructing new data points within the range of a discrete set of known data points. In engineering and science, one often has a number of data points, obtained by sampling or experimentation, which represent the values of a function for a limited number of values of the independent variable. It is often required to interpolate, i.e., estimate the value of that function for an intermediate value of the independent variable.
Let's take a look at the monthly airline passenger data in the US between 1949 and 1960 (download data set here). Dataset has several months missing from the data.
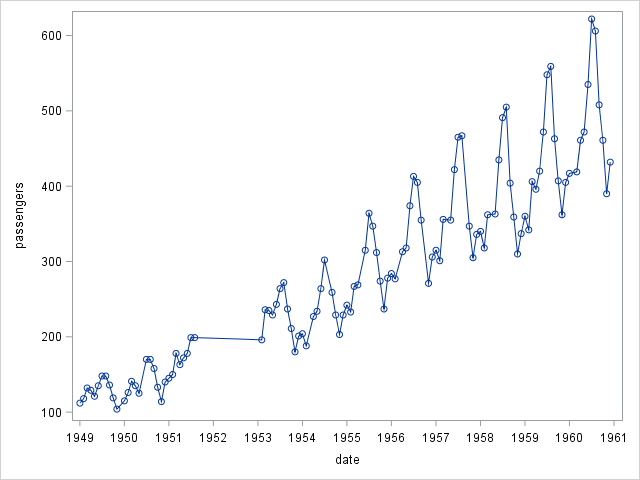
Further analysis of this data usually requires missing values filled. This can be done by hand but we have a better way of doing it: PROC EXPAND.
								PROC EXPAND DATA=tutorial.airpassengers_exp OUT=airp_smooth FROM=MONTH;

								ID date;

								CONVERT passengers;

								RUN;
We can plot the converted data to see the result:
								PROC SGPLOT DATA=airp_smooth;

								SERIES X = date Y = passengers;

								RUN;
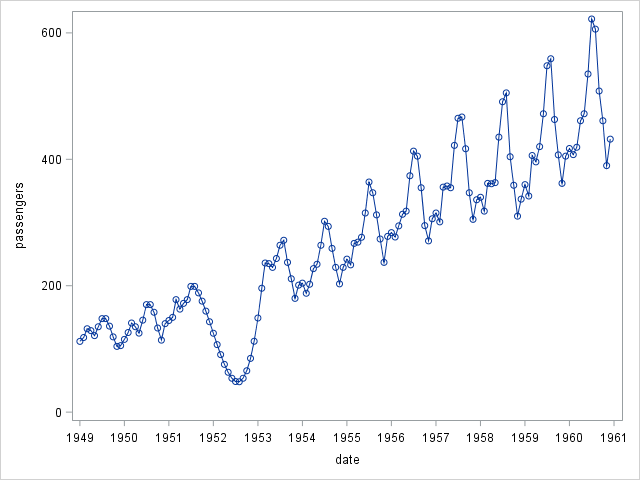
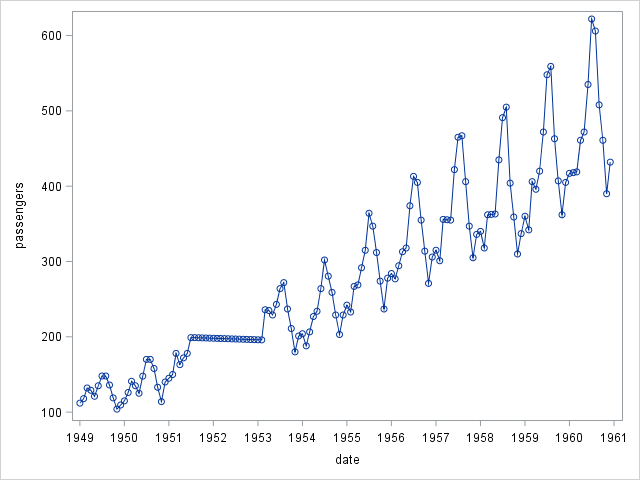
Default method for converting data is SPLINE. Other available methods are JOIN, STEP and AGGREGATE. We can specify this option in the CONVERT statement:
								PROC EXPAND DATA=tutorial.airpassengers_exp OUT=airp_smooth FROM=MONTH;

								ID date;

								CONVERT passengers / METHOD = JOIN;

								RUN;
Changing the Frequency of Time Series
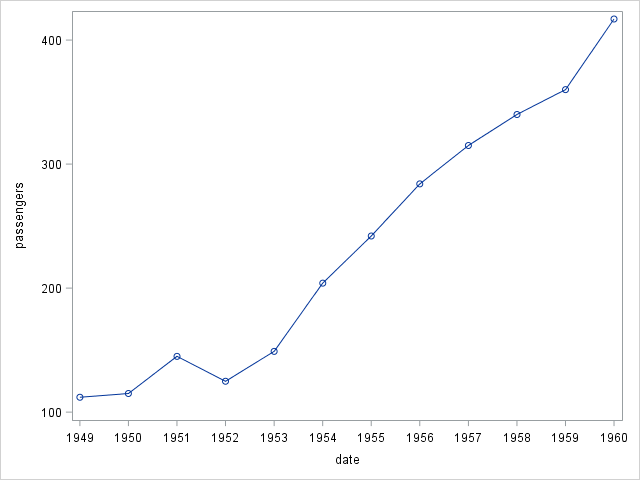
One of the most popular features of EXPAND procedure is changing the frequency of the data. In the air passengers example we demonstrated above, number of passengers is given in monthly periods. Say we are only interested in annual averages. To do that we have to specify the data to be converted FROM which frequency (month in this case) TO which frequency (i.e. year):
								PROC EXPAND DATA=tutorial.airpassengers_exp OUT=airp_smooth FROM=MONTH TO=YEAR;

								ID date;

								CONVERT passengers;

								RUN;


Leave a Comment